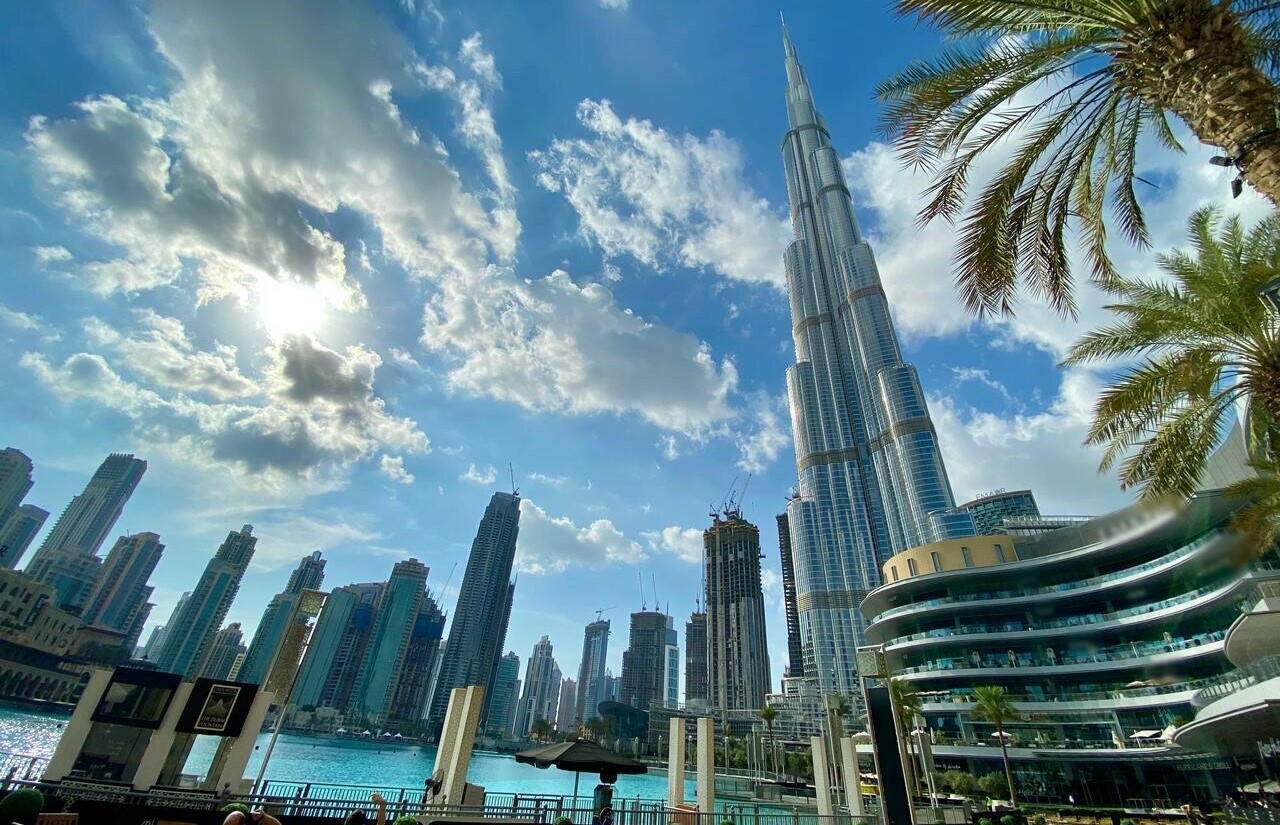

While Dubai, Aspen, Riyadh, Tokyo, and Miami have emerged as the top prime residential markets on the basis of PIRI 100 (Prime International Residential Index) 2022, Indian cities- Mumbai, Delhi, and Bengaluru have climbed up the ladder. PIRI 100 tracks the movement of luxury house prices across the world.
According to Knight Frank Wealth Report 2023, Dubai maintained top position with prime residential prices accelerating 44.2% in 2022, followed by Aspen (27.6%), Riyadh(25%), Tokyo(22.8%) and Miami(21.6%). Mumbai has emerged as 18th most expensive (in US dollar terms) prime residential market in the world.
Of the 100 markets tracked in PIRI, 85 recorded positive or flat growth in 2022. Among the Indian cities, Mumbai’s property market witnessed price appreciation of 6.4%, moving up to the 37th position in 2022, as opposed to the 92nd position in 2021. Bengaluru witnessed 3% prime property appreciation, climbing up to 63rd position from 91 whereas Delhi saw appreciation by 1.2%, moving up to 77th rank as against 93rd position.
PIRI 100 Price Tracker
|
As of 31st December 2022 |
As of 31st December 2021 |
|||
|
Indian City |
Annual Price Change (%) | Ranking on PIRI 100 (year 2022) | Annual Price Change (%) | Ranking on PIRI 100 (year 2021) |
|
Mumbai |
6.40% | 37 | 0.3% | 92 |
| Bengaluru | 3.00% | 63 | 0.3% |
91 |
| Delhi | 1.20% | 77 | 0.0% |
93 |
| No. | Location | Annual Change % |
| 1 | Dubai | 44.2% |
| 2 | Aspen | 27.6% |
| 3 | Riyadh | 25.0% |
| 4 | Tokyo | 22.8% |
| 5 | Miami | 21.6% |
| 6 | Prague | 16.3% |
| 7 | Algarve | 15.3% |
| 8 | Bahamas | 15.0% |
| 9 | Athens | 13.0% |
| 10 | Porto | 12.7% |
| 37 | Mumbai | 6.4% |
| 63 | Bengaluru | 3.0% |
| 77 | Delhi | 1.2% |
According to Kate Everett -Allen, Partner, Residential Research, Knight Frank, wealth preservation, safe-haven capital flight, and supply constraints played their part in driving prime price growth, but it was the post-pandemic surge that continued to push prices higher. For the world’s wealthy, this increased their appetite to buy, with 17% of UHNWIs adding to their portfolios in 2022.
The costliness of the prime residential space can be judged from the space one can buy in USD one million. Compared to 17 sq mts of space available for USD 1 million in Monaco, 21 sq mts in Hongkong and 338 sq mts in NewYork, Mumbai, Delhi and Bengaluru respectively offer 113 sq mts , 226 sq mts and 385 sq mts of prime residential space. LLION BUY?
Area (in sq mts) purchasable for US$1 million in Mumbai, Delhi and Bengaluru(last five years)
| Cities | 2018 | 2019 | 2020 | 2021 | 2022 |
| Mumbai | 100 | 102 | 106 | 108.1 | 113 |
| Delhi | 201 | 197 | 202 | 206.1 | 226 |
| Bengaluru | 224 | 336 | 351 | 357.3 | 385 |
Prime Property Area (in sq mts) purchasable for US$1 million in key global cities
| City | 2022 |
| Monaco | 17 |
| Hong Kong | 21 |
| New York | 33 |
| Singapore | 34 |
| London | 34 |
| Geneva | 37 |
| Los Angeles | 39 |
| Paris | 43 |
| Sydney | 44 |
| Shanghai | 44 |
| Beijing | 58 |
| Tokyo | 60 |
| Miami | 64 |
| Berlin | 70 |
| Melbourne | 87 |
| Dubai | 105 |
| Madrid | 106 |
| Mumbai | 113 |
| Cape Town | 218 |
| Sao Paulo | 231 |
According to Shishir Baijal, Chairman & Managing Director, Knight Frank India, Indian residential markets have shown growth in demand for the last many quarters, leading to a rise in sales momentum of high-end properties. Mumbai ranked second amongst APAC markets after Tokyo with 6.4% year-on-year rise in values
1
2
3
4
5
6