
The leading 8 residential markets continue to show strong growth momentum, with mid and high-end housing rising at the cost of affordable homes.
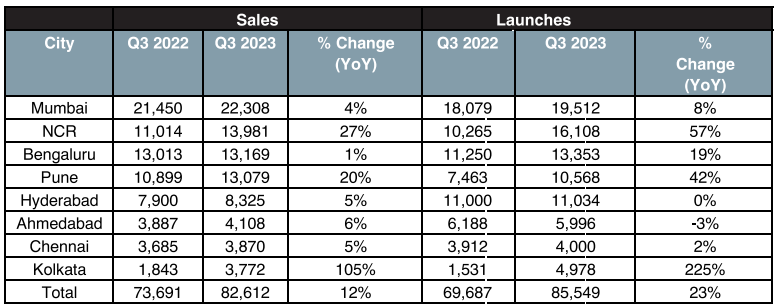
According to a Knight Frank report, during Q3 2023, these markets saw a surge in demand with sales of 82,612 residential units, clocking a growth of 12% YoY In volume terms while Q3 stood out with a six-year high quarterly sales volumes.
The mid and the high – end category of residential properties saw a further rise in sales momentum in Q3 2023. While properties costing more than INR 10 mn saw a YoY rise of 39%, the mid-segment at INR 5 – 10 Mn saw a rise of 14% YoY in Q3 2023. A total of 28,642 units costing over INR 10 mn each were sold in this quarter followed by 29827 units costing INR 5 – 10 mn each. The affordable segment, or homes costing less than INR 5 mn saw a YoY decline of 10% at 24,143 units.
Developers responded to this strong demand by increasingly launching new projects. A total of 85,549 new residential units were launched in Q3 2023, registering a growth of 23% YoY. Price levels in all markets across India grew in tandem with demand and Hyderabad saw the most significant rise at 11% YoY, due to an increased focus on premium properties.Sales were prominently skewed towards mid and premium price segments. The current Quarters to Sale (QTS) level of 6.5 quarters, significantly better than the 7.1 level a year ago, signified an improving demand dynamic in the residential real estate market of the country.
Source: Knight Frank Research
Demand Supply Economics: Sales velocity maintained, Supply levels significantly elevated
The momentum in residential sales has sustained even as an inflationary environment forced the Researve Bank of India (RBI) to push up the Repo Rate by 250 bps to 6.5% earlier this year, a level not exceeded since 2016. Despite that, the Indian residential market achieved sales of 82,612 units across the eight cities at a growth of 12% YoY. Kolkata saw the highest growth at 105% YoY, largely due to a pronounced base effect caused by the market transitioning into the RERA environment during Q3 2022. Among the larger markets, NCR stood out with a 27% growth in sales during the quarter. Sales volumes in Pune grew by 20% YoY while the rest of the markets experienced steady single digit growth during the quarter.
With 23% YoY growth during Q3 2023, supply levels at 85,549 units were significantly elevated as developers look to capitalise on the steady homebuyer demand.
Sales acceleration in mid and premium segment, Affordable segment hardest hitThe underlying fabric of the market got altered significantly with the mid and premium segments constituting the bulk of sales while affordable segment witnessed a decline in volume.
Below INR 5 mn Ticket Size Homes
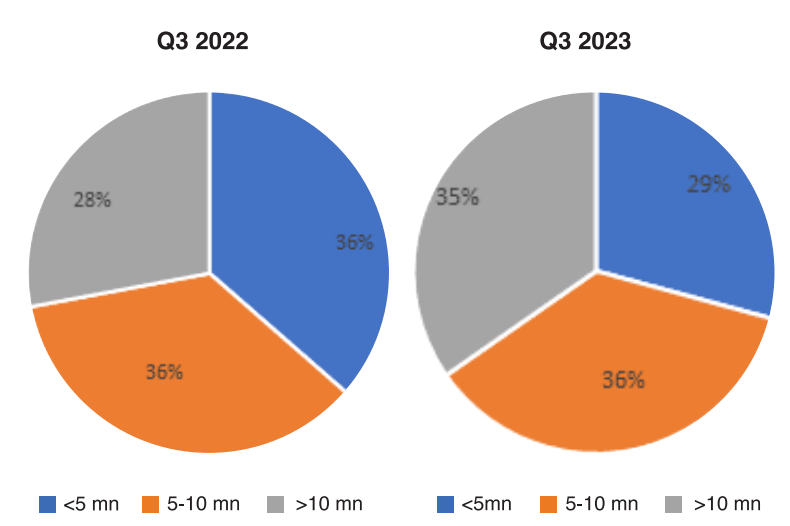
The share of the INR 5 mn (INR 50 lakhs) and below ticket-size homes deteriorated from 36% (with sales of 26,831 units ) to 29% (with sales of 24,143 units ) in Q3 2023. The triple effect of increasing prices, rising home loan rates and the comparatively adverse impact of the pandemic in this segment continued to weigh down on demand. This was for the first time that the quarterly sales share of this segment got eclipsed by that of the mid as well as premium segments. The current sales share of 29% is a far cry from the 54% levels in 2018.
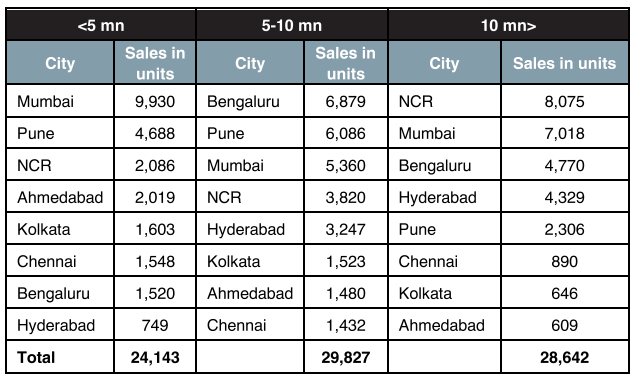
Incidentally, the most expensive residential market in the country, Mumbai, which would find maximum traction for the affordable segment witnessed an annual de-growth of 2.6% YoY in this category during the quarter. The affordable housing sales declined from 10,198 units in Q3 2022 to 9,930 units in Q3 2023 in Mumbai.
Between INR 5-10 mn Ticket Size Homes
With a sales share of 36%, the highest volume of residential sales was recorded in the ticket size of INR 5-10 mn or mid-residential segment. Sales in this ticket-size category recorded an annual growth of 14% at 29,827 units during Q3 2023. Bengaluru (6,879), Pune (6,086) and Mumbai (5,360) together accounted for more than 60% of sales in this ticket size.
INR 10 mn & Above Ticket Size
Consistent with an upward trend seen in the past seven quarters, the share of sales in the INR 10 mn (INR 1CR) and above ticket-size or premium segment grew significantly to 35% in Q3 2023 compared to 28% a year ago. In Q3 2023, this ticket size category witnessed a growth of 39% YoY to 28,642 housing unit sales from 20,591 in Q3 2022. With sales of 8,075 units, NCR constituted 28% of the sales volume which is highest in the premium segment in the country. NCR is followed by Mumbai and Bengaluru at 7,018 units and 4,770 units, respectively.
Demand Analysis by Ticket Size (Q3 2022 vs Q3 2023)
Source: Knight Frank Research
City-wise Ticket Size Demand Analysis (Q3 2023)
Source: Knight Frank Research
In YTD analysis >10 Mn category outperforms affordable segment in 2023 vs 2018
In a year-to-date analysis of the top markets, when compared to 2018 or five years ago, the first 9 months of 2018 registered sale of 187,152 units. Of the total, over 100,000 residential units were in the category of INR 5 Mn or below, a formidable 54% of the total sales in the first 9 months. As compared to that, the INR 5- 10 Mn category recorded sales of a little over 57,000 making up 32%, while INR 10 Mn and above saw sales of 29,485 making up a modest 16% of total sales achieved between January – September 2018.
Category-wise demand analysis (Jan – Sept 2018 vs Jan – Sept 2023)
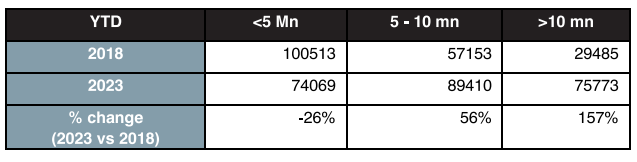
However, these dynamics altered greatly in 2023. While the total sales achieved in the first nine months of the year stood at 239,252 units, representing a rise of 28% over 2018, the breakup in the categories are remarkably different. The category of homes costing less than INR 5 Mn saw decline of 26% in absolute terms over that achieved in 2018. With 74,069 units sold in this category between January – September 2023, it made up 31% of the total sales achieved. The most interesting change has been in the INR 10 Mn and above category which when compared to 2018 saw a rise of 157%, selling over 75,000 residential units in the first nine months of 2023. For the first time sales in the high-end segment overtook sales in the affordable segment. This is a very significant change depicting that the market has shifted/ tilted towards higher value properties while the affordable segment languished due to rising cost factors. The mid segment category of INR 5- 10 mn also recorded a 56% growth when compared to 2018 with sales of 89,410 units in 2023.
Residential price appreciation observed for all the leading eight markets
The weighted average prices have appreciated for all the leading eight markets in tandem with demand growth in YoY terms. Price levels in Hyderabad saw the most significant rise at 11% YoY as focus increasingly shifted towards development of premium high-rise properties. Mumbai continues to be the most expensive market at INR 7600/sq ft.
Average price change across markets during Q3 2023
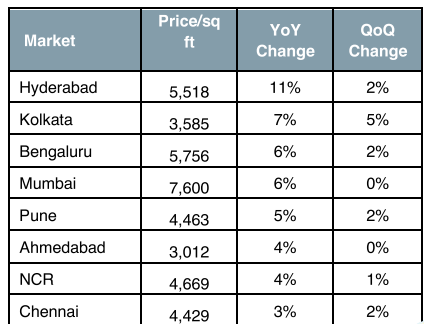
Source: Knight Frank India
According to Shishir Baijal, Chairman & Managing Director, Knight Frank India, while the overall growth of residential market is welcoming, the decline in affordable housing is worrisome because it’s been the largest buying segment , crucial for the long-term industry growth . Prolonged slowdown could harm the real estate sector in the long- term. Therefore, stakeholders must reconsider strategies to revive the affordable segment and maintain its momentum.
1
2
3
4
5
6