
Flexspace stock that stands at 43.5 msf across top 6 cities, will continue to see high growth with flex space leasing expected to constitute an impressive 15-20 percent of overall office leasing by the end of 2023.
According to a recent Colliers report, India’s flex space stock is likely to touch 80 mn sq ft by 2026, forming 9-10% of the total Grade A office stock of the country. India’s flex space market has grown stronger and bigger post pandemic, faster than its peers in the APAC region. Flex space stock across the top 6 cities has almost doubled since 2019, and currently stands at 43.5 mn sq ft, an impressive 6.3% of the total Grade A office stock. This is relatively higher compared to 3-4% flex space market penetration in other key markets within APAC. Indian office market clearly indicates a higher affinitity for shared work spaces. A positive economic outlook, evolving workplace trends, increasing diversification of occupier-base will continue to drive flex space demand across the top markets in the country.
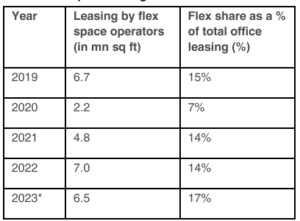
Flex leasing in India has gathered significant momentum in recent years and spurt in flex activity continued in 2023 as well. . By the end of 2023, flex space leasing is estimated to constitute an impressive 15-20% of overall office leasing.This, according to Arpit Mehrotra, MD, South India Office Services & Head of Flex Colliers India ,reiterates the evolving needs of businesses, that places greater emphasis on agility & flexibility in today’s dynamic work environment,
Trend in flex space leasing
Source: Colliers
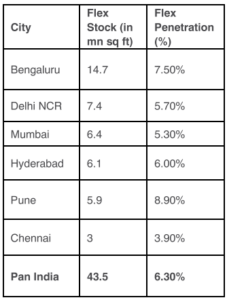
Data pertains to Grade A Buildings and top 6 cities – Bengaluru, Chennai, Delhi-NCR, Mumbai, Hyderabad, and Pune 2023*- Data as of September 2023 Bengaluru remains the largest flex space market housing one third of the total flex stock of the country, followed by Delhi-NCR. Prominent tech hubs such as Pune and Hyderabad are also witnessing increased traction and are expected to grow at a faster pace owing to rising demand from large technology occupiers. Interestingly, Pune currently has the highest flex space penetration at 8.9%, followed by Bengaluru at 7.5%.
City-wise flex stock and penetration
Source: Colliers
Data pertains to Grade A Buildings Flex space penetration indicates share of flex stock in total Grade A office stock of the city 2023*- Data as of September 2023 Similar to the overall India office market, the flex market is also highly concentrated in certain prominent clusters across the Tier I cities. Top 10 flex micro-markets such as ORR-Bengaluru, SBD-Bengaluru, SBD-Hyderabad, Andheri East-Mumbai, Baner Balewadi-Pune, etc house almost 60% of the total flex stock of the country. SBDs, owing to their strategic location, superior connectivity to other parts of the city, and strong physical & social infrastructure, remain most active flex markets within cities, accounting for more than half of the flex stock of the country. CBDs, which were the primary hubs for flex spaces, have seen limited activity in recent years due to scarce availability of new age Grade A workplaces and relatively high rentals. Peripheral markets, on the other hand are fast emerging as flex market hotspots owing to comparatively lower price points, upgradation of infrastructure and improving connectivity within the city. As occupiers look to decentralize their office portfolios to enable distributed workforce strategy, PBDs are poised to witness significant upswing in next few years.
Driven by the flexibility, agility, and cost-effectiveness, flex spaces are becoming an integral part of occupiers’ portfolio, with its share in occupiers’ total portfolio rising to an estimated 10-12 percent in 2023, from 5-8% before the pandemic in 2019. Annual flex seat uptake by occupiers has already witnessed a 6-fold growth in 2023 as compared to 2020. Technology occupiers have been one of the driving forces of rising flex space demand across the country, currently occupying over half of the total flex space across the top 6 cities. However, the demand for flex space is getting more diversified with all occupier categories, including non-tech firms such as engineering & manufacturing, BFSI, and consulting adopting flex spaces. There has been an increased flex space take up from non-enterpirse clientele including domestic startups and new age companies as well.
1
2
3
4
5
6